The 4 golden signals for monitoring systems: quick and dirty with examples
Monitoring systems with the four golden signals with examples
The 4 Golden Signals of Monitoring are a set of metrics that help you understand the health and performance of your system.
Latency: the time it takes for a request to be processed. Latency is important because it can affect user experience and can be an indicator of performance problems. You should monitor the 99th percentile of request latency to detect outliers and set alerts if latency exceeds a certain threshold.
Traffic: the rate of requests coming into your system. Traffic is important because it can affect system capacity and availability. You should monitor traffic to detect changes in traffic patterns and set alerts if traffic exceeds a certain threshold.
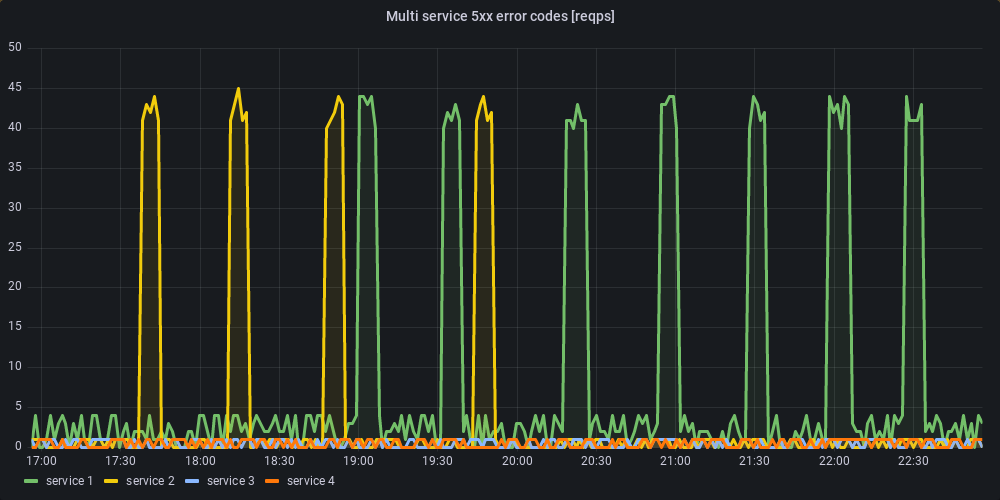
Errors: the rate of requests that result in errors. Errors are important because they can indicate problems with the system or with user input. You should monitor the rate of 5xx errors and set alerts if the error rate exceeds a certain threshold.
Saturation: the degree to which a resource is being utilized. Saturation is important because it can indicate that a resource is becoming a bottleneck. You should monitor the CPU and memory usage of your system and set alerts if they exceed a certain threshold.
For example, if you have a web application, you might monitor the following alerts:
Latency: alert if the 99th percentile of request latency exceeds ${n} second
Traffic: alert if the rate of incoming requests exceeds ${n} requests per minute
Errors: alert if the rate of 5xx errors exceeds ${n}% of all requests
Saturation: alert if CPU usage exceeds ${n}% or memory usage exceeds ${n}%
By monitoring these 4 Golden Signals, you can gain insight into the health and performance of your system and be alerted to potential problems before they become critical.


